将 Prometheus 和 Grafana 与 Redis Enterprise Software 结合使用
使用 Prometheus 和 Grafana 收集和可视化 Redis Enterprise Software 指标。
您可以使用 Prometheus 和 Grafana 收集和可视化 Redis Enterprise Software 指标。
指标在集群、节点、数据库、分片和代理级别公开。
- Prometheus 是一个开源的系统监控和告警工具集,用于聚合来自不同来源的指标。
- Grafana 是一个开源的指标可视化工具,用于处理 Prometheus 数据。
您可以使用 Prometheus 和 Grafana 进行以下操作:
-
收集和显示管理控制台中不可用的指标
-
为节点或集群事件设置自动告警
-
显示 Redis Enterprise Software 指标以及来自其他系统的数据
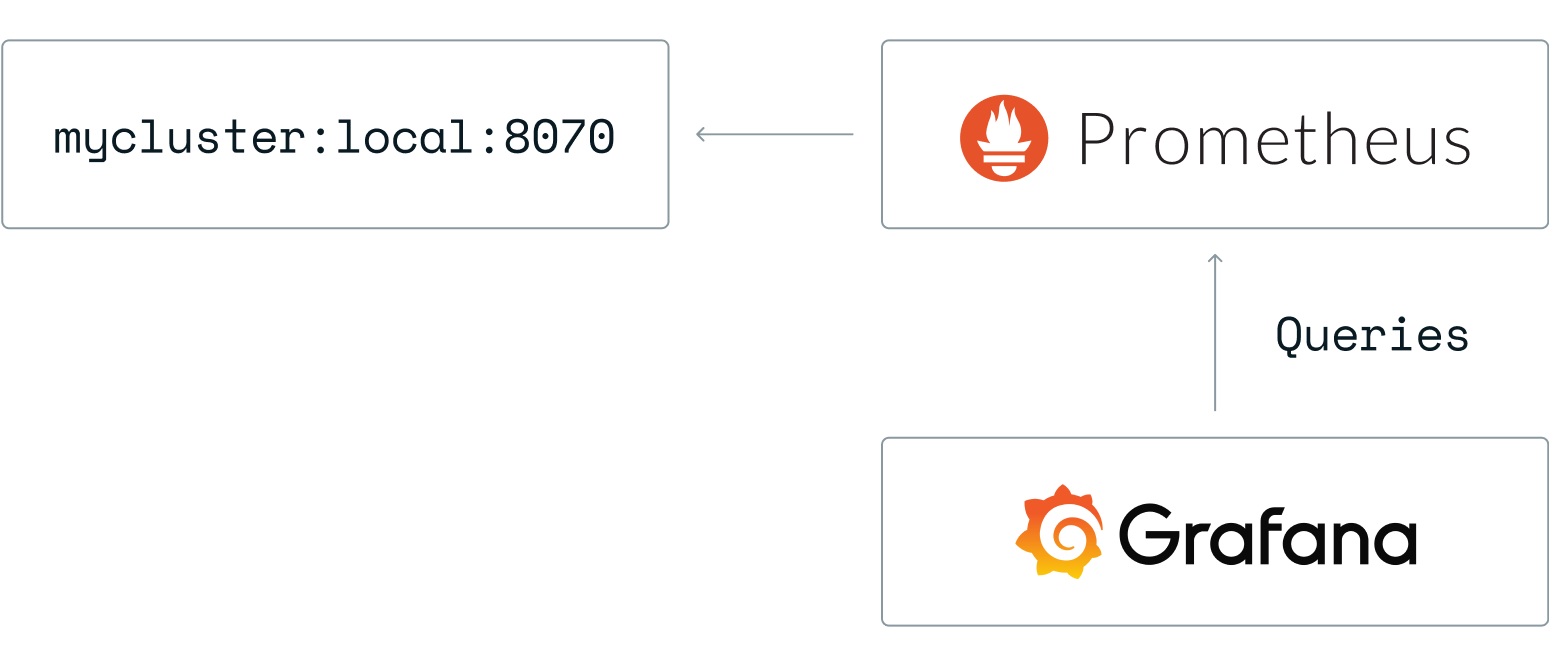
在每个集群中,metrics_exporter 进程在端口 8070 上公开 Prometheus 指标。Redis Enterprise 7.8.2 版本引入了新的指标流引擎的预览版,该引擎在 https://<IP>:8070/v2 公开 v2 Prometheus 抓取端点。
快速入门
开始使用 Prometheus 和 Grafana:
-
在本地机器上创建一个名为 'prometheus' 的目录。
-
在该目录中,创建一个名为
prometheus.yml的配置文件。 -
将以下内容添加到配置文件中,并将
<cluster_name>替换为您的 Redis Enterprise 集群的 FQDN注意我们建议仅将 Prometheus 在 Docker 中用于开发和测试。global: scrape_interval: 15s evaluation_interval: 15s # Attach these labels to any time series or alerts when communicating with # external systems (federation, remote storage, Alertmanager). external_labels: monitor: "prometheus-stack-monitor" # Load and evaluate rules in this file every 'evaluation_interval' seconds. #rule_files: # - "first.rules" # - "second.rules" scrape_configs: # scrape Prometheus itself - job_name: prometheus scrape_interval: 10s scrape_timeout: 5s static_configs: - targets: ["localhost:9090"] # scrape Redis Enterprise - job_name: redis-enterprise scrape_interval: 30s scrape_timeout: 30s metrics_path: / # For v2, use /v2 scheme: https tls_config: insecure_skip_verify: true static_configs: - targets: ["<cluster_name>:8070"] -
设置您的 Prometheus 和 Grafana 服务器。要在 Docker 上设置 Prometheus 和 Grafana:
-
创建一个 docker-compose.yml 文件
version: '3' services: prometheus-server: image: prom/prometheus ports: - 9090:9090 volumes: - ./prometheus/prometheus.yml:/etc/prometheus/prometheus.yml grafana-ui: image: grafana/grafana ports: - 3000:3000 environment: - GF_SECURITY_ADMIN_PASSWORD=secret links: - prometheus-server:prometheus -
要启动容器,请运行:
$ docker compose up -d -
要检查所有容器是否已启动,请运行:
docker ps -
在浏览器中,登录 Prometheus (https://:9090) 以确保服务器正在运行。
-
选择 Status,然后选择 Targets,检查 Prometheus 是否正在从您的 Redis Enterprise 集群收集数据。
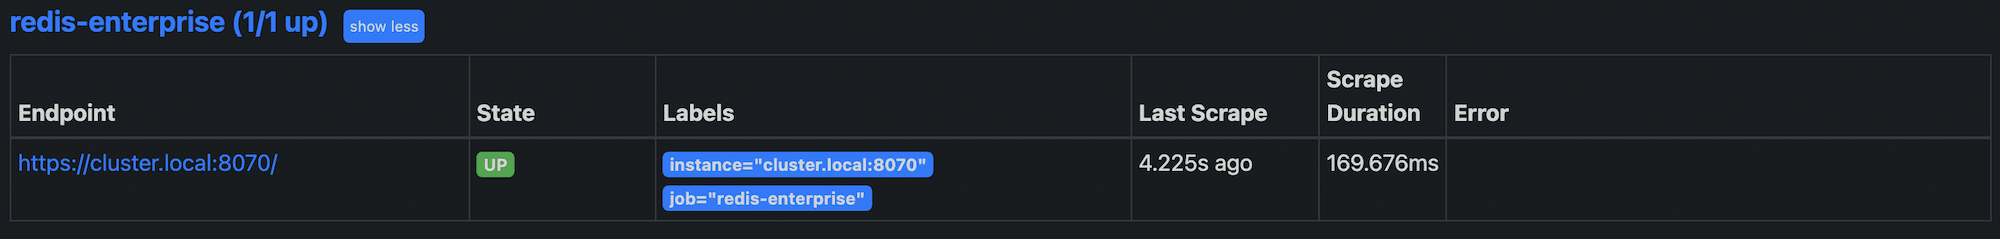
如果 Prometheus 已连接到集群,您可以在 Prometheus 主页的 Expression 字段中键入 node_up 查看集群指标。
-
-
配置 Grafana 数据源
-
登录 Grafana。如果您在本地安装了 Grafana,请访问 https://:3000 并使用以下信息登录:
- 用户名:admin
- 密码:secret
-
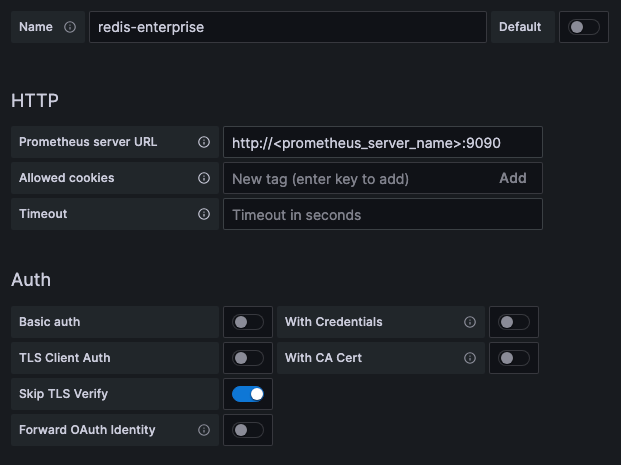
在 Grafana 配置菜单中,选择 Data Sources。
-
选择 Add data source。
-
从数据源类型列表中选择 Prometheus。

-
输入 Prometheus 配置信息:
- 名称:
redis-enterprise - URL:
http://<您的 prometheus 服务器名称>:9090
- 名称:
注意- 如果网络端口对 Grafana 服务器不可访问,请从 Access 菜单中选择 Browser 选项。
- 在测试环境中,您可以选择 Skip TLS verification。
-
-
添加集群、数据库、节点和分片指标的仪表盘。要添加预配置的仪表盘:
- 在 Grafana 仪表盘菜单中,选择 Manage。
- 点击 Import。
- 上传一个或多个Grafana 仪表盘。
Redis Enterprise 的 Grafana 仪表盘
Redis 发布了四个用于 Redis Enterprise 和 Grafana 的预配置仪表盘:
- 集群状态仪表盘提供了 Redis Enterprise 集群的概览。
- 数据库状态仪表盘显示特定的数据库指标,包括延迟、内存使用情况、每秒操作数和键数量。
- 节点指标仪表盘提供托管您集群的每个节点的指标。
- 分片指标仪表盘显示在集群节点上运行的单个 Redis 进程的指标
- Active-Active 仪表盘显示特定于Active-Active 数据库的指标。
这些仪表盘是开源的。有关更多仪表盘选项或提交问题,请参阅Redis Enterprise observability Github 仓库。
有关配置 Grafana 仪表盘的更多信息,请参阅Grafana 文档。